


How to Actually Use AI for Risk Stratification in Healthcare
A non-engineering guide written by an engineer

AI is taking over healthcare. Suddenly, everyone is trying to build AI, implement AI tools, evaluate them, or become an AI influencer on LinkedIn. Despite all this hype, most people don't actually understand how AI works. They either view it as a magic solution—dump data into ChatGPT and solve everything—or dismiss it entirely as overhyped nonsense.
The reality is more nuanced. AI is genuinely transformative, but only when you understand which problems it solves well versus where it struggles, how to evaluate AI products effectively, and what implementation actually requires.
I think not enough engineers are involved in the discussion around how AI is built, implemented, and regulated in healthcare. After 15 years of building ML systems—from founding Avon Health (the first AI-native EMR to receive ONC certification) to deploying models at Microsoft, PathAI, Carnegie Mellon, and Stanford—I've seen the gap between what works in practice versus what sounds good in whitepapers. I hold a patent in cloud ML, wrote my thesis on computer vision to restore functional vision in the blind, and helped create the #1-rated ML major at Carnegie Mellon. More importantly, I've actually built and deployed regulated healthcare AI products, not just theorized about them.
That's why I'm launching this series on healthcare AI fundamentals: to cut through the noise with an engineer's perspective. Over the next few posts, I'll break down how the most common healthcare AI applications actually work under the hood—starting with one that many care delivery companies claim to use but few truly understand: risk stratification.
The Problem: Identifying High-Risk Patients
Imagine you're running a chronic care management company. You have 1,200 patients with diabetes and hypertension, and you want to identify which ones are most likely to end up in the hospital or emergency room in the next six months. Your goal is to stratify patients by risk so you can allocate your limited resources—care coordinators, remote monitoring devices, intensive interventions—to those who need them most.
Your first instinct might be to use ChatGPT. Just dump all the electronic health record (EHR) data into the system and ask it to rank patients by risk, right?
Wrong.
Why ChatGPT Fails at Risk Stratification
ChatGPT being bad at risk stratification is just like ChatGPT originally being bad at counting the number of R's in "strawberry." Both require structured reasoning, not just language prediction.
When you ask ChatGPT how many R's are in "strawberry," it doesn't loop through each letter and count—it generates an answer that sounds right based on patterns it's seen before. Sometimes it gets it right. Sometimes it confidently says "two" or "four." It's guessing, not calculating.
To properly assess a patient's risk, you need to systematically pull out specific medical facts like their age, what diseases they have, and how their lab results are changing over time. Then you need to run these numbers through mathematical formulas or algorithms that can weigh each factor correctly. Everything needs to be clear so doctors can understand how the system reached its conclusion.
LLMs get easily sidetracked. They might read "Patient seems well today 😊" and think everything's fine, while completely missing that the patient's kidney function is dangerously poor (creatinine of 3.5) and they just got out of the hospital.
The core problem is that LLMs are built to write convincing sentences, not to carefully analyze medical data the way doctors need to make life-and-death decisions.
The Right Approach: Mathematical Models for Medical Prediction
Instead of relying on language models, you need AI models specifically designed for mathematical prediction. Here's how to build an effective risk stratification system:
Step 1: Define Your Population and Prediction Goal
To build an effective risk prediction model, you first need to clearly define who you're studying and what you're trying to predict. For this example, we're focusing on all adult patients aged 18 and older who have type 2 diabetes, hypertension, or both conditions, and who've had at least one outpatient visit in the past year. Let's assume this gives us 1,200 patients to work with.
Our goal is to forecast each patient's probability of experiencing a high-cost event within the next six months—specifically, an unplanned hospital admission or emergency department visit caused by diabetes-related complications or a hypertensive crisis. We'll label patients who had at least one such hospitalization or ED visit as positive cases, while patients who avoided these events will be labeled as negative cases.
This clear definition is crucial because it determines everything else about your model—what data you'll need to collect, how you'll measure success, and ultimately whether your predictions will be useful for preventing the costly emergencies you're trying to avoid.
Step 2: Extract and Engineer Features from the EHR
The most critical step in building a successful risk prediction model is transforming raw EHR data into meaningful features—and this is where most projects fail. Most electronic health records weren't designed for machine learning; they're built for clinical documentation and billing. Raw EHR data is filled with missing values, redundant information, inconsistent formatting, and data entry errors that follow the classic "garbage in, garbage out" principle.

Instead of feeding this messy data directly into your model, you need to systematically extract meaningful features using a 12-month lookback window. Think of this as creating a comprehensive patient profile that captures everything clinically relevant about their current state and recent health trajectory.
Here are some of the key features that you could extract:
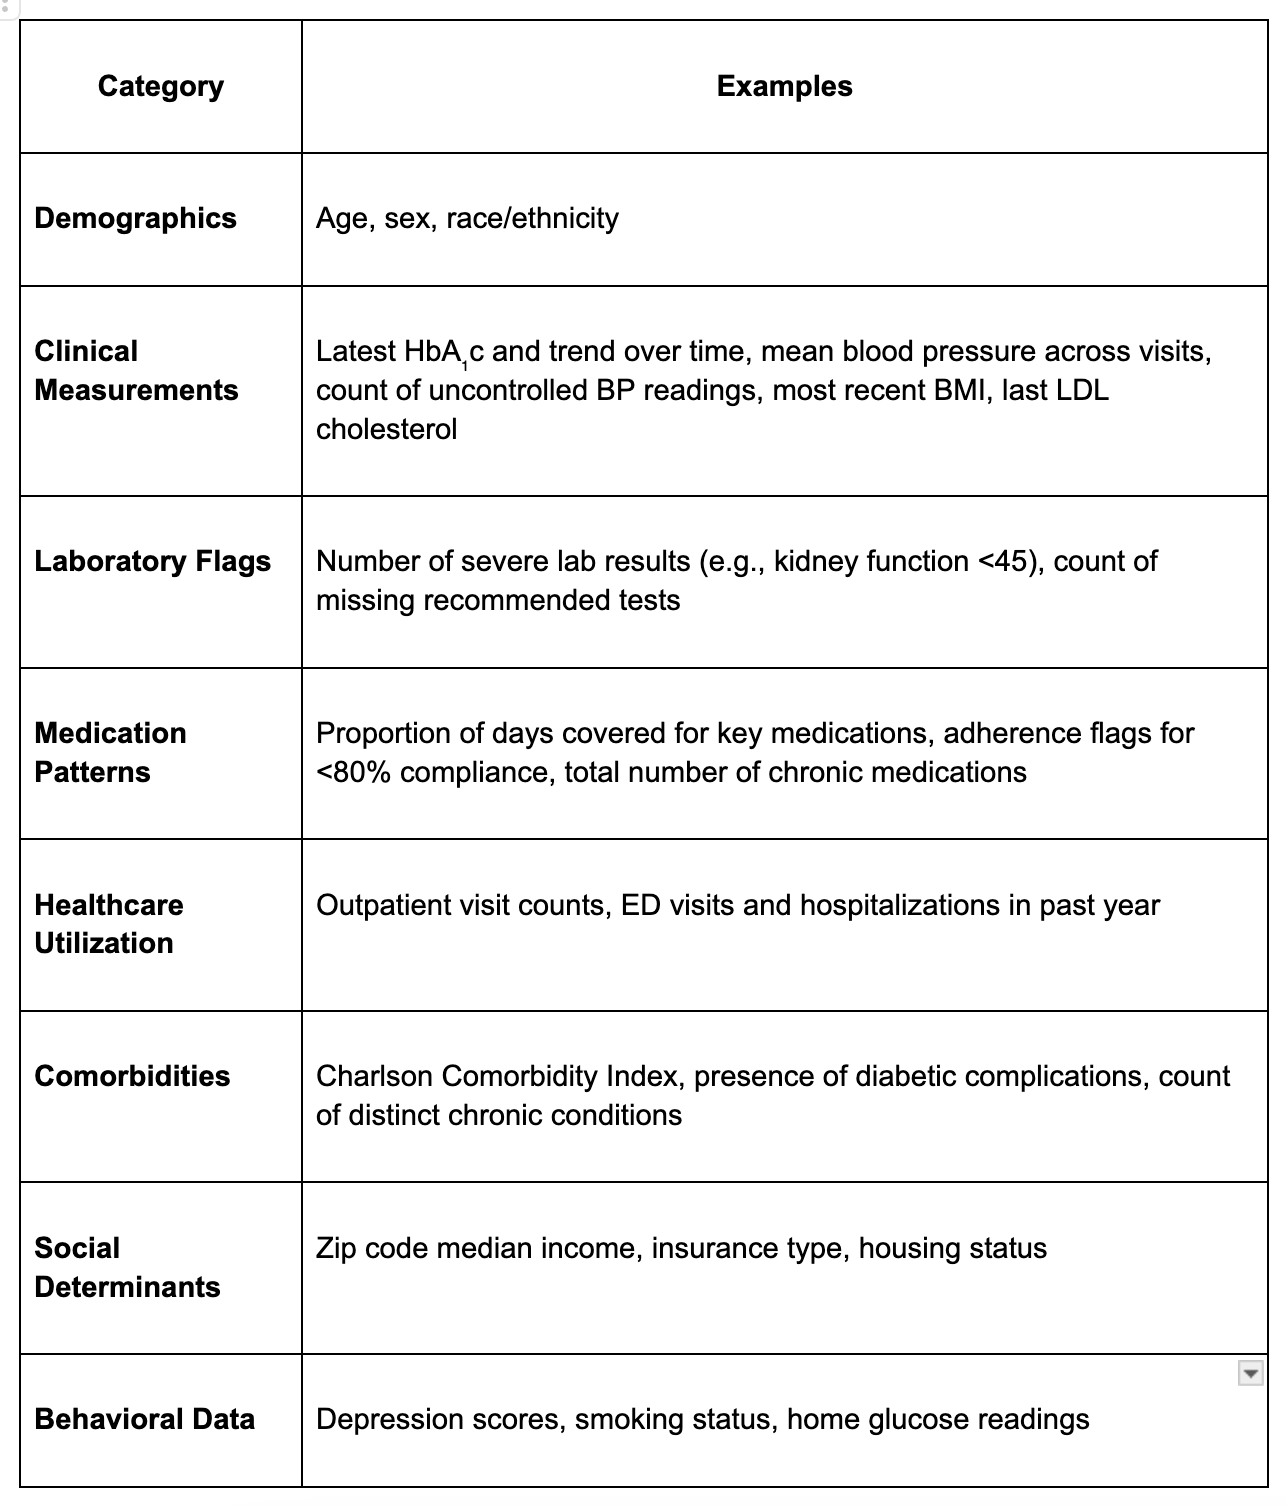
The real art lies in engineering new features that combine existing data in clinically meaningful ways. Creating these engineered features is crucial because raw healthcare data rarely tells the complete clinical story on its own.
You can create aggregations that summarize data over time, like "average systolic BP over the last 3 months" or "number of BP readings above 140/90 in the last 6 months." Ratios combine features for deeper insights, such as medication adherence percentages (filled prescriptions divided by expected fills) or BMI calculations.
Time-based features capture disease duration and care patterns through variables like "age at diagnosis," "time since last hospitalization," or "number of hospitalizations in the last 12 months." Binning converts continuous variables into clinically relevant categories, such as grouping blood pressure into "normal," "pre-hypertensive," and "hypertensive stages" to capture non-linear relationships.
Interaction features reveal how multiple factors work together to influence risk, like "age × number of comorbidities," which might show that older patients with many conditions face exponentially higher risk than either factor would suggest alone.
Step 3: Prepare Data for Machine Learning
Now you need to transform your carefully extracted features into a format that machine learning algorithms can understand and process effectively. This step is crucial—even the best features won't help if the data isn't properly prepared.
Handle Missing Data Strategically
Electronic health records are notoriously incomplete. Lab tests aren't ordered for every patient, fields get left blank, and data entry errors occur. You can't just ignore missing data or mark it as "unknown"—that creates artificial patterns that will mislead your model.
For continuous variables like A1c or LDL cholesterol, you have two main approaches. First, you can impute median values, which means replace missing numbers with the middle value from all your other patients. Or else, you can use model-based imputation that predicts what the missing value should be based on other patient characteristics—for example, predicting a missing A1c based on the patient's age, medications, and other lab values. You can also leverage LLMs to find missing values buried in unstructured clinical notes.
The key insight is that if you mark missing A1c as "-1" or "unknown," you're telling the model that all missing values are identical, which creates false relationships. A better approach is to create a "missiveness flag"—a separate yes/no column that tells the model "this A1c value was originally missing." This captures cases where the absence of data itself might be clinically meaningful, like when doctors don't order certain tests because the patient seems stable.
For categorical variables like smoking status, sometimes it's better to keep "unknown" as its own category when the missing information itself might be clinically relevant.
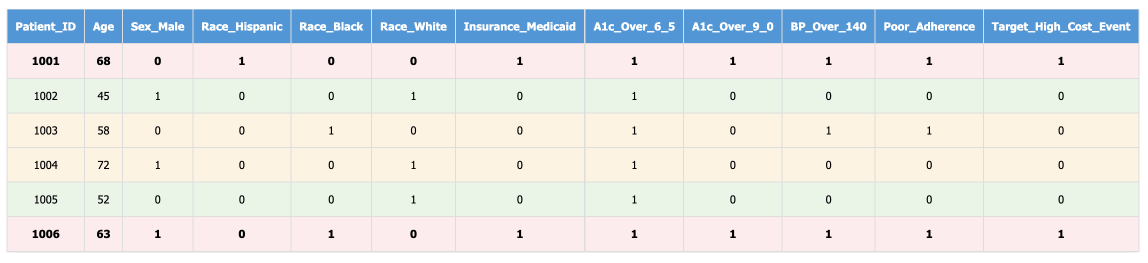
Encode Categorical Variables (One-Hot Encoding)
Machine learning algorithms work with numbers, not text labels. But you can't just assign arbitrary numbers to categories—if you code insurance types as Medicare=1, Medicaid=2, Commercial=3, you're accidentally telling the algorithm that Commercial insurance is "three times better" than Medicare, which makes no sense.
One-hot encoding solves this by creating separate yes/no columns for each category:

This tells the algorithm that these are distinct, equal categories without any implied ranking or mathematical relationship.
Normalize Continuous Variables (Standardization)
Different lab values have wildly different scales. LDL cholesterol might range from 50-200 mg/dL while A1c ranges from 5-15%. Without normalization, the LDL differences will completely overwhelm the A1c differences in the model's calculations, essentially making A1c invisible to the algorithm.
Standardization fixes this by transforming all values to have a mean of 0 and standard deviation of 1:

Now A1c and LDL values are on the same scale, so both contribute equally to the model's learning process.
Create Binary Clinical Flags
Lab values often have specific thresholds where clinical meaning changes dramatically. Instead of treating A1c as a smooth continuum, you can create binary flags that capture these clinical cut-points:

These flags help the model understand that moving from A1c 8.9% to 9.0% has much greater clinical significance than moving from 6.0% to 6.1%—the relationship between lab values and risk isn't always linear.

Step 4: Train and Validate the Model
Before you can build your model, you need to split your 1,200 patients into three groups. Use 70% (840 patients) for training the model, 15% (180 patients) for validation to fine-tune settings, and 15% (180 patients) for final testing to get an unbiased performance evaluation.
Choosing the Right Machine Learning Approach
Understanding which type of machine learning to use is crucial for healthcare applications. There are three main categories, each suited for different problems.
Supervised learning is what you want for risk stratification. This approach learns from labeled examples where you already know the correct answer—in your case, which patients were actually hospitalized. It's perfect for predicting hospital readmissions, diagnosing diseases from medical images, or identifying high-cost patients because you have historical data showing the outcomes you want to predict.
Unsupervised learning finds hidden patterns in data without knowing the "right answer." It's useful for patient segmentation, discovering natural patient groups, or detecting unusual vital sign patterns. However, it's not right for risk stratification because you already have a specific target you want to predict.
Deep learning uses neural networks with multiple layers to automatically learn complex patterns from raw data. It excels at medical image analysis, processing clinical notes, or analyzing genomic sequences. But for tabular risk prediction with structured data like lab values and demographics, deep learning is typically overkill—it requires massive datasets and often performs no better than simpler models while being much harder to interpret.
Why Gradient Boosting for Healthcare Risk Prediction
Within supervised learning, you have many algorithm choices, but gradient boosting machines like XGBoost or LightGBM typically perform best for healthcare risk prediction with tabular data. Here's why they're ideal: they handle mixed data types seamlessly, processing continuous variables like A1c values alongside categorical variables like race and binary flags like diabetes complications without extensive preprocessing. They automatically capture non-linear relationships and discover complex patterns like "patients with both uncontrolled diabetes AND poor medication adherence have exponentially higher risk." They're also robust to outliers from data entry errors and consistently deliver high predictive accuracy in healthcare applications while remaining reasonably interpretable.
Fine-Tuning Your Model: Understanding Hyperparameters
Once you've chosen your algorithm, you need to optimize its settings. It's important to understand the difference between model parameters and hyperparameters.
Model parameters are the internal settings that the algorithm learns automatically from your training data. In XGBoost, these are the specific decision rules at each split in each decision tree, like "If A1c > 8.5, go left; otherwise go right." The algorithm determines these automatically during training as it analyzes your 840 training patients.
Hyperparameters are the external settings you choose before training begins. These control how the model learns, not what it learns. Key XGBoost hyperparameters include max_depth (how deep each decision tree can grow), learning_rate (how aggressively the model learns from each mistake), n_estimators (how many decision trees to build), and min_child_weight (minimum number of patients required in each leaf node).
Why Hyperparameter Tuning Matters
Poor hyperparameter choices can dramatically hurt performance. If your settings are too simple, like max_depth=1, the model underfits—it's like forcing a decision tree to only ask one yes/no question about each patient. It might only consider "Is A1c > 7?" and completely miss the complex interactions between age, comorbidities, and medication adherence.
If your settings are too complex, like max_depth=20, the model overfits—it memorizes the training data's quirks instead of learning generalizable patterns. It might create overly specific rules like "68-year-old Hispanic females with A1c=8.2% and exactly 3 ED visits are high risk" that don't apply to new patients.
The goal is finding the sweet spot, like max_depth=6, that captures meaningful clinical relationships without overfitting to noise in your training data.

Step 5: Evaluate Model Performance
When evaluating how well your risk model works, you need to look at three different measures that each tell you something important.
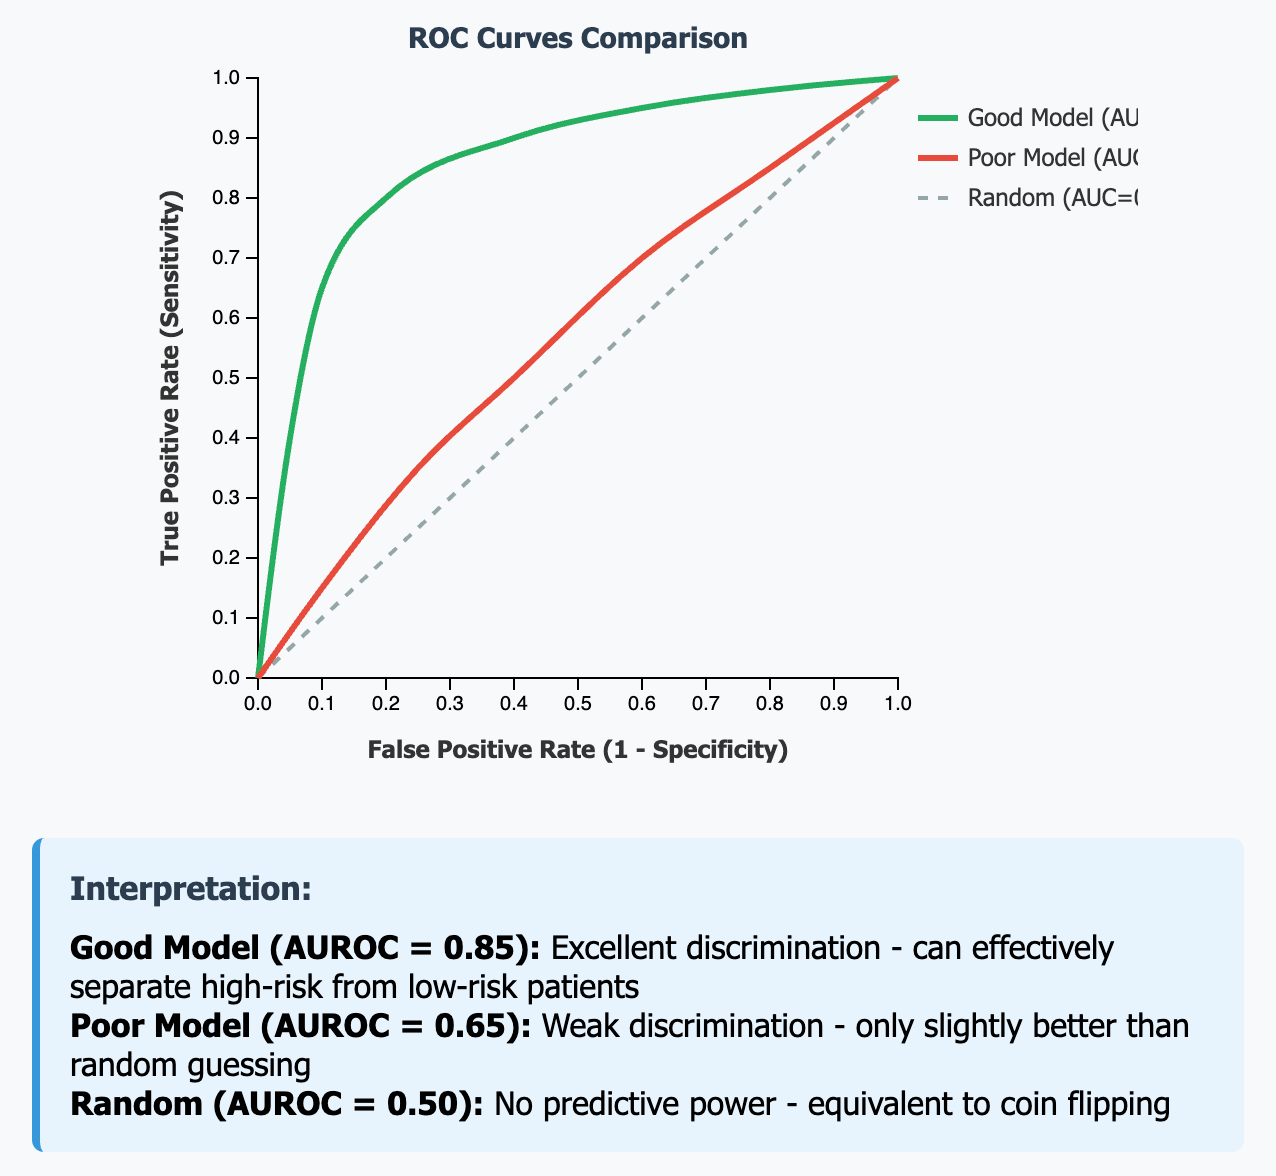
AUROC (Area Under ROC Curve):
AUROC measures how well your model can separate high-risk from low-risk patients. Think of it like asking "If I randomly pick one high-risk patient and one low-risk patient, how often will the model correctly identify which is which?" A perfect score is 1.0, meaning it never gets confused. However, AUROC has a major weakness: it doesn't work well when you have way more healthy patients than sick ones. AUROC gets easily fooled because it treats false positives and false negatives as equally important. Imagine you're trying to predict a rare disease that affects 1% of patients. A lazy model could just predict "low risk" for everyone and still get a decent AUROC score around 0.5-0.7 because it's correctly identifying 99% of the healthy patients as low-risk, even though it's missing 100% of the sick patients. AUROC sees all those correct "healthy" predictions and thinks the model is doing okay, when in reality it's completely useless for finding sick patients.
AUPRC (Area Under Precision-Recall Curve):
AUPRC solves the problem AUROC has by focusing specifically on how good your model is at finding the high-risk patients you're trying to catch. AUPRC only cares about two things: when you flag someone as high-risk, are they actually high-risk (precision), and out of all the truly high-risk patients, how many did you catch (recall). It completely ignores all those healthy patients that AUROC gets distracted by. If your model predicts "low risk" for everyone, AUPRC will give it a terrible score because its recall is zero—it caught none of the high-risk patients. AUPRC forces the model to prove it can actually find the needle in the haystack, not just correctly identify that most of the haystack isn't a needle. The downside is that AUPRC scores tend to be lower and harder to interpret than AUROC scores.

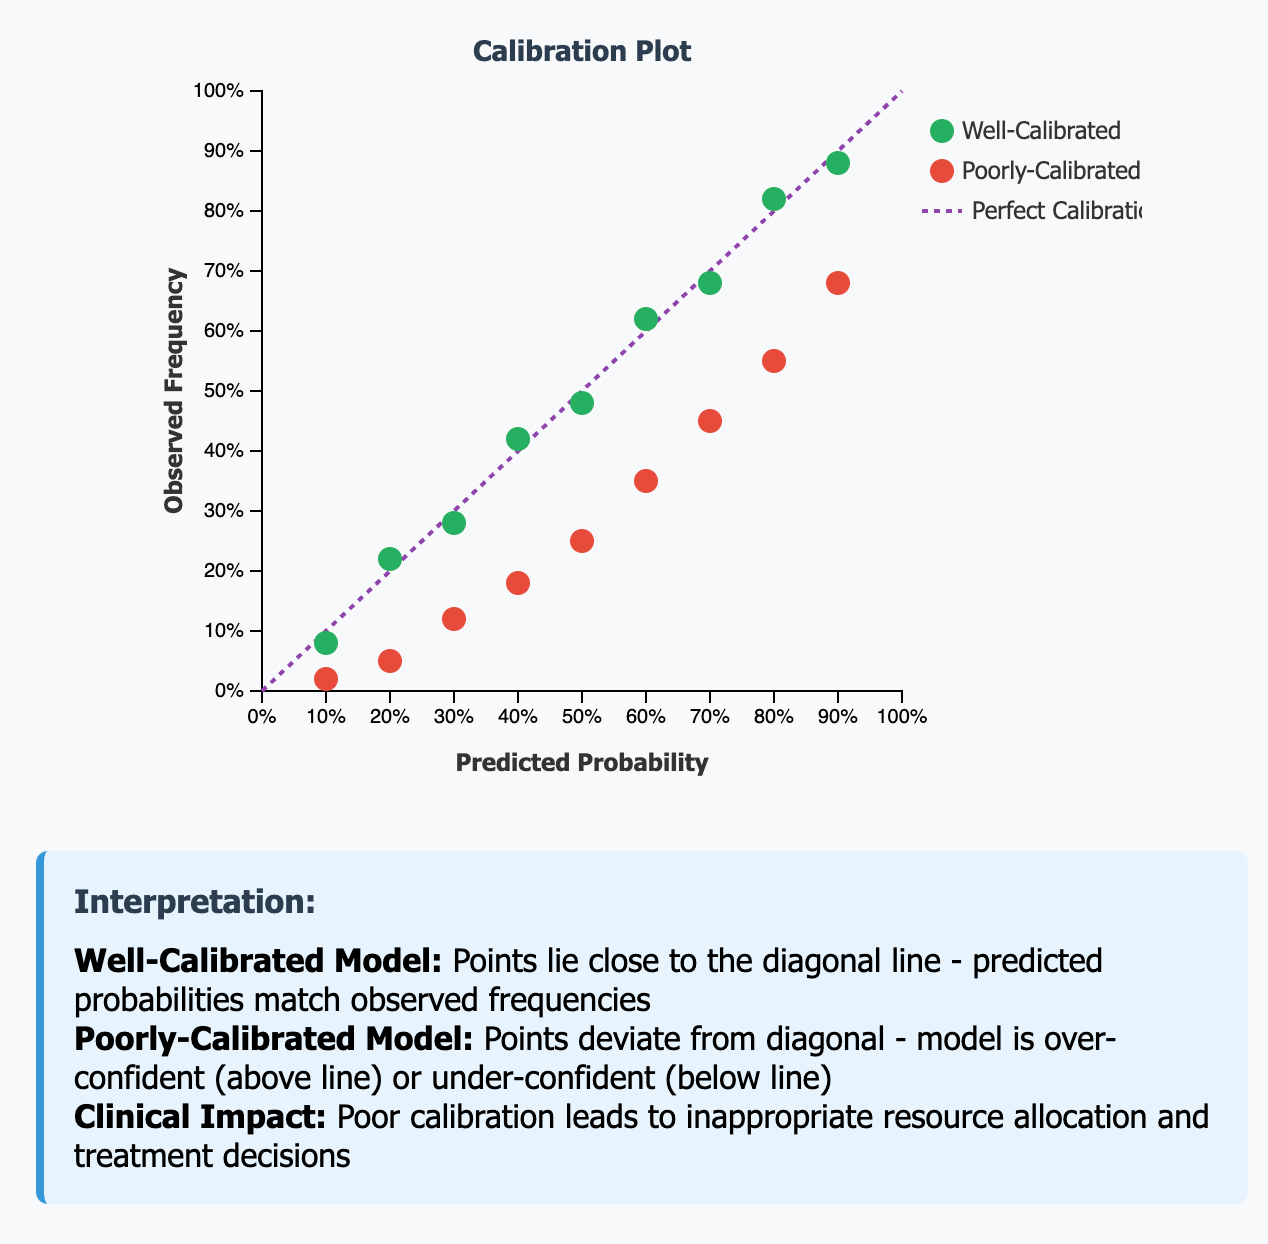
Calibration:
Calibration checks whether your model's confidence matches reality. If your model says a group of patients has a 30% chance of being hospitalized, then roughly 30 out of every 100 patients in that group should actually end up in the hospital. This is crucial because doctors need to trust the numbers they're given. A model might be great at ranking patients from low to high risk but terrible at giving accurate probability estimates, which makes it hard to use in practice.
Step 6: Generate Risk Scores and Create Strata
Once your model is trained and validated, you can apply it to all 1,200 patients in your population to generate individual probability scores. Each patient receives a specific percentage that represents their likelihood of experiencing a high-cost event in the next six months.
However, raw probability scores alone aren't actionable for busy clinical teams. A doctor can't easily process that one patient has a 47% risk while another has a 52% risk. Instead, you need to translate these continuous probabilities into meaningful risk categories that guide clinical decision-making.
The most effective approach is creating risk strata based on percentiles of your population. Designate the top 20% of patients as high risk—these might have scores of 60% or higher and represent your most vulnerable patients who need immediate intervention. The middle 30% become moderate risk patients with scores between roughly 30-60%, requiring enhanced monitoring and preventive care. The bottom 50% are low risk with scores below 30%, suitable for standard care protocols.
This stratification creates clear action plans for different patient groups. Consider two examples from your population: Patient A is a 68-year-old woman who has had diabetes for 10 years, with a poorly controlled A1c of 10.2%, poor medication adherence (missing 40% of doses), and two emergency department visits in the past year. Your model assigns her a 78% risk score, placing her squarely in the high-risk category that demands immediate case management and intensive support.
In contrast, Patient B is a 45-year-old man diagnosed with diabetes just one year ago, maintaining good control with an A1c of 7.1%, excellent medication adherence, and no emergency visits. His 12% risk score places him in the low-risk category, where standard diabetes care and routine monitoring are sufficient.
These risk strata transform abstract probability scores into concrete clinical workflows, allowing healthcare teams to efficiently allocate their limited resources to the patients who need them most.
Step 7: Monitoring and Continuous Improvement
Deploying your risk prediction model is just the beginning—the real work starts once it's actively guiding patient care decisions. Unlike a static clinical guideline, your model exists in a dynamic healthcare environment where practice patterns evolve, patient populations shift, and new treatments emerge. Without ongoing monitoring and updates, even the best model will gradually lose accuracy and relevance.
The first priority is tracking actual outcomes against your predictions. Monitor the real hospitalization rates within each risk stratum to validate that your model continues performing as expected. If your high-risk patients are only experiencing events 30% of the time instead of the predicted 60%, something has changed that requires investigation. This could indicate improvements in care delivery, changes in patient management protocols, or shifts in your patient population.
Calibration monitoring ensures your predicted probabilities still match reality across different risk ranges. When your model assigns a 40% probability to a group of patients, roughly 40 out of every 100 should actually experience the predicted event. Poor calibration can mislead clinicians about the urgency of interventions and undermine trust in the system.
Regular retraining keeps your model current with evolving healthcare practices. You should plan to update the model every six months using recent data, incorporating new practice patterns, medication changes, and population dynamics. For example, if your health system implements a new diabetes management program or if telehealth adoption changes patient engagement patterns, these shifts need to be reflected in your model's understanding of risk factors.
Lastly, you should monitor for bias across demographic subgroups to ensure equitable care delivery. Your model might perform well overall while systematically under-predicting risk for certain racial groups or over-predicting for others. Regular bias audits help identify these disparities before they translate into unequal care allocation, ensuring that your risk stratification tool enhances rather than perpetuates healthcare inequities.
The Bottom Line
AI risk stratification works—but not through the magical thinking that dominates healthcare AI discussions. It requires careful feature engineering, appropriate model selection, rigorous validation, and thoughtful integration into clinical workflows.
The payoff is substantial: better resource allocation, improved patient outcomes, and more efficient care delivery. But success depends on understanding that effective healthcare AI is built on mathematical rigor, clinical expertise, and systematic implementation—not on dumping data into ChatGPT and hoping for the best.
Hi Maitreyee, very informative, thx for sharing. Curious: once you have done all the data wrangling to prepare for ML, could you just get away with a standard multi variable component analysis? I also wonder if the deep thinking LLMs would work if you gave them a structured process for analyzing a patient the same way a clinician would. I.e. but I guess this works only if physicians have good predictive abilities themselves…